|
Prospects of Nuclear Energy in India in relation to France
Sankar Hajra
Abstract
In this article, in a context of nuclear energy generated by France in 2004 we study the fuel viability of Uranium. We examine (i) the data given in the Energy Mix Fact Sheet-France 2004, (ii) the data on economic expenditure for nuclear Plant Operation, nuclear Plant Building and Decommissioning , Waste Disposal and after Fukushima Surveillance and (iii) the energy expenditure data for extraction of Uranium from the Uranium ore (with 0.067% Uranium content) of Olympic Dam of South Australia (that would produce in 2011 one seventeenth of the total Uranium production of the world). From these three groups of data using standard mathematical procedures / standard chemical procedures we present evidence showing that fuel viability of Uranium prepared from ores containing 0.067% or more Uranium may be positive, but that prepared from 0.01% Uranium Ore is negative. Therefore, we may naturally ask the nuclear technologists of India: if France has no better or little better utility of Uranium fuel processed from 0.3 % ores than coal , how India will get commercial benefit using her 0.01 % domestic grades of Uranium ores or 0.1% grades of Uranium ores imported from Niger?
Keywords: Real fuel, false fuel, Nuclear Electricity, Energy-investment, Energy-return, intrinsic cost advantage, carbon-di-oxide emission
Introduction:
Martin Heinrich Klaproth discovered Uranium (Uranium-238) in Berlin in 1789. Its name was given after the name of the planet Uranus. Natural Uranium (Uranium-238, henceforth Uranium) contains 0.7% Uranium-235 which acts as fuel burning-up to high amount of heat energy through some ingenious secret devices. Therefore, Uranium is considered as one of the prospective commercial fuels.
We show that (A) burn-up energy per gram of Uranium is within 72, 380 KcalsH and 87, 430 KcalsH, (B) commissioning and decommissioning of reactors, waste disposal and after-Fukushima-surveillance work require 38,223 KcalsH per gram of Uranium burn-up, (C) fuel viability of Uranium prepared from ores containing 0.067% or more Uranium may be positive, but that prepared from 0.01% UraniumOre is negative, (D) foreign carbon-dioxide emissions to produce 10,500 tonnes of Uranium that France imports from foreign countries, each year, total about 32.6 million tonnesfor0.067% ores and 218.4 million tonnes for 0.01% ores per year, (E) hidden Carbon-di-oxide emission relating to yearly burn –up of 10, 500 tons of Uranium is 183 million tonnes distributed over half a century in aggregate before and after the reactor-life-time, (F) France’s nuclear power is in no way more competitive or of lower cost than many of other options for supplying electric power and finally judge the prospects of Nuclear energy in India for commercial use.
The aim of our study is to judge the fuel viability of Uranium and its effectiveness for commercial use to increase the electricity consumption per capita in India and some other developing countries in the South Eastern Asia.
Material and Methods:
We collected data from reports like, The Costs of Nuclear Power Sector, Summary of the Public Thematic Report by the Cour des Comptes (2012), The Costs of Nuclear Power Sector, Thematic Public Report by Cour des Comptes, Main Report (2012), Index Mundi (2019), International Atomic Agency (1993), World Nuclear Association ( 2014, 2019 ), World Steel Association (2014, 2019), Massachusetts Institute of Technology (2003, 2018), Wikipaedia (2019) etc.
The conclusion of the article is based on data analysis method. Collected data of the aforementioned sources were analyzed and compared to decide. Energy expenditure were calculated from standard physico –chemical processes as given in the classical chemical calculation book like “Chemical calculation” of Ashley, R. Harman (1915) along with David M. Himmeblau’s “Supplementary problems for basic principles and calculations in chemical engineering” (1996).
Discussion:
Real fuel and 'false fuel'
To know whether a fuel is real fuel or not is to determine whether the fuel has a positive net energy-yield (energy-return) i.e., the fuel produces greater amounts of energy when it is used than the energy investment in extracting the fuel from basic raw materials and making, processing, transporting as well as disposing of residues of the fuel. A huge amount of energy is obtained when Hydrogen, Aluminium or thermite (a mixture of powdered aluminium and oxides of iron) are burned. But energy obtained from combustion of those fuels is not greater than the energy spent to make them from natural resources. Therefore, hydrogen and thermite cannot be treated as real fuels. Electricity could be readily generated from combustion of those fuels but electricity made from those fuels will be more energy-expensive than electricity made from coal or petroleum. Hydrogen and Aluminium, although seemingly prospective as fuels, are actually false or energy-negative fuels. Similarly, it is said by nuclear technologists that one thermal MW day energy is required to produce 0.9 gram of Plutonium.
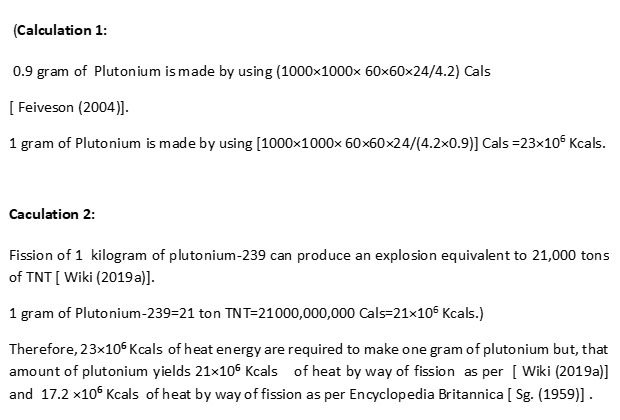
Hence, plutonium just like hydrogen and Aluminium is a false fuel. False fuels may serve as real fuel only when they are available as formerly useless by-products and benefit from 'upstream energy subsidies'.
Primary Energy Supply in France
Now, to analyze the claims of France, we need to know (a) how much fossil fuel and renewable fuel (hydroelectricity, geothermal energy, waste-to-energy, wind turbines, solar photovoltaic and CSP), as well as gas by-products of industry such as blast furnace gases used in France as primary fuel supply, (b) Electricity generated and (c) French final consumption for the end uses of energy.
We give below France’s primary energy supply and final consumption of energy in 2004 as per France –Energy Mix Fact Sheet [ FEMFS (2004)].
Table 1. Energy mix fact sheet-France-2004
Mtoe |
Primary supply |
Domestic Production |
Net imports |
Final Consumption |
Electricity Generation (TWh) |
Solid fuels |
14.1 |
0.5 |
13.3 |
4.8 |
25.8 |
Oil |
92.8 |
1.7 |
94.1 |
74.0 |
5.9 |
Gas |
39.2 |
1.7 |
37.8 |
33.4 |
21.2 |
Nuclear |
115.6 |
115.6 |
|
|
448.2 |
Electricity |
|
|
-5.3 |
35.8 |
|
Renewables |
17.3 |
17.4 |
-0.1 |
9.9 |
66.0 |
Other |
-5.3 |
|
|
|
5.2 |
Total |
273.7 |
136.4 |
139.8 |
157.9 |
572 |
(Mtoe = Million ton oil equivalent, TWh = Trillion Watthours)
Fuel viability of Uranium Fuel used by France
World Nuclear Association mentions that 17 % of France’s nuclear electricity generated (448.2 TWh) comes from recycled materials . 15 TWh electricity went only to Tricastin Uranium Enrichment Plant to enrich Natural Uranium [WNA (2019)].
France’s nuclear reactors consumed 10,500 tonnes of Uranium . Therefore from 10,500 tonnes of Uranium, France got (448.2−76.2−15) TWh= 357 TWh electricity in 2004.
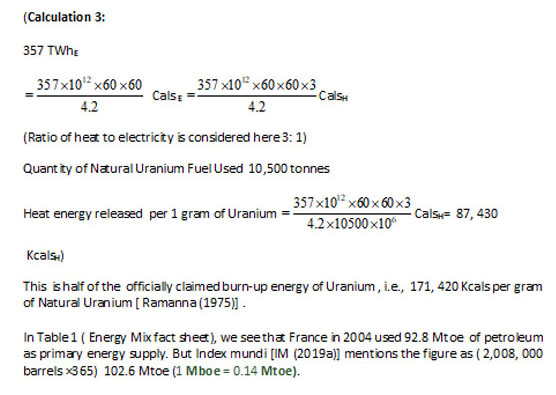
In the same table we see that in 2004 France used 14.1 Mtoe of coal as primary energy supply, but Index Mundi [IM (2019)a] provides figures as (23,767, 000 short tons) 21.6 Mtoe ( 1 short ton = 0.907185 metric ton). Therefore, we may conclude that France might have used 163.4 Mtoe of fossil fuels in 2004 and not 146.10 Mtoe. In case France used 163.4 Mtoe of Fossil fuel in 2004 as per Index Mundi (2019)b, instead of 146.1 Mtoe of Fossil fuel as per her Energy Mix data of that year, heat energy released per gram of Uranium will be 72, 380 KcalsH instead of 87,430 KcalsH i.e., average 80, 000 Kcals/gram (approximately) considering heat of combustion of coal = 8 Kcals/gm. and that of crude petroleum 10 Kcals/gm.
This study upholds our proposition (A):burn-up energy per gram of Uranium is within 72, 380 KcalsH and 87, 430 KcalsH.
Energy Expenditure for Plant Operation, Plant Building & Decommissioning , Waste Disposal and after Fukushima Surveillance
Nowadays (2010), reactor installment cost is 9 b$ per reactor and decommissioning , waste disposal and after Fukushima surveillance cost 9 b$ per reactor .
Energy expenditure for these two performances = One-sixth of the total cost (say)= 3 b$ per reactor. This suggests that energy expenditure for plant building, decommissioning, waste disposal & after-Fukushima-surveillance is 38, 223 Kcals per gram of Uranium.
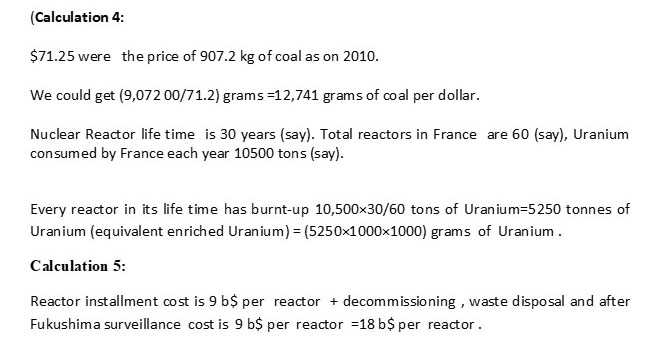
As per World Steel Association [WSA (2019)], “On average, 20 GJ of energy is consumed per tonne of crude steel produced globally”. As per World Steel Association [WSA (2014)] , energy constitutes a significant portion of the cost of steel production from 20%-40% in some countries. To commission and to decommission a nuclear reactor, similar proportion of energy cost is plausible. Therefore, we may consider that energy expenditure for these two performances = 1/6th of 18 b$ = 3 b$ per reactor.
For burn up of 1 gram of Uranium (or equivalent enriched Uranium), energy expenditure for reactor installment & decommissioning (along with waste disposal and after-Fukushima-surveillance) cost = 3,000,000,000 / (5250×1000×1000) dollars= 0.6 dollar
Coal used =12,741×0.6 grams ≡12,741× 0.6 × 5 Kcals= 38, 223 Kcals.
Proportionate Energy expenditure for reactor installment & decommissioning (along with waste disposal and after-Fukushima-surveillance) to burn –up 1 gram of Uranium ( or equivalent enriched Uranium) =38,223 Kcals).
This upholds our proposition (B): analysesof energy expenditure show that commissioning & decommissioning of reactors, waste disposal and after-Fukushima-surveillance work require 38,223 Kcals per gram of Uranium burn-up.
Now let us find what amount of energy was spent to prepare that amount of Uranium from its available ores?
Status of Uranium as fuel, real or false?
Uranium is not available in nature in a free state. It is available in ores. Recent Uranium mining activities are constrained to use ores that contain only 0.01-0.05 % of Uranium [Herring (2004)]. In actual practice, taking account of mining and operation losses, many Uranium mines process approximately 2000 grams of their ores to yield 1 gram of natural Uranium. The ore is treated with various chemicals to separate Uranium from other ingredients [Hyett (1984)]. To produce those chemicals, heat energy is abundantly required. Now, heat required for chemical processes comes generally from the combustion of fossil fuels. Therefore, to prepare Uranium fuel, fossil fuels are required in the long run. But the essential question is: how much fossil fuel is required to get 1gram of Uranium from its now available ores? We give a simple study to elucidate this problem below.
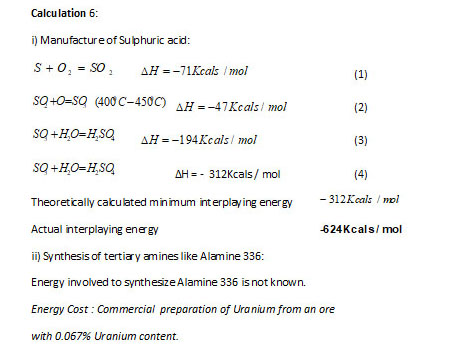
After preliminary concentration to remove sand and clay, the ore is leached with sulphuric acid and treated with an excess of the acid and then with hydrogen sulphide to precipitate all metallic radicals other than Uranium. The filtrate is then treated with an excess of ammonium hydroxide to precipitate Uranium as ammonium diurate which is ignited to prepare U3O8. This U3O8 is reduced to UO2 by hydrogen. The di-oxide is converted into Uranium fluoride by heating it strongly in gaseous hydrogen fluoride. The fluoride is then reduced to the metal by means of pure metallic calcium. However, now a-days selective tertiary amines are used to separate Uranium from the leached solution of the ore.
Sulphuric Acid, Hydrochloric Acid, Hydrogen Sulphide, Sodium Carbonate, Ammonium Hydroxide, Hydrogen and Calcium are not available in nature. In the ultimate analysis, fossil fuels and other chemicals are required to prepare those elements and compounds. We now tabulate the energy interplayed/ involved/ used / required in making those basic chemicals needed to extract natural Uranium from its ores.
Generally, the volumes of chemicals needed in any manufacturing process will be twice the theoretically calculated minimal volumes. This is partly due to processing energy required for the upkeep or maintenance of the production system and other technical formalities to be maintained for the operation.
We study the situation from well known verifiable data. To produce highly pure Uranium from an ore with 0.05% Uranium, chemical energy expended is given below:
Energy interplayed / involved to manufacture basic chemicals used to extract Uranium from its ore.
In the Uranium extraction process basic chemicals are sulphuric acid, hydrochloric acid, hydrogen sulphide, ammonia and sodium carbonate and tertiary amines. We are first tabulating energy interplayed/ involved to manufacture sulphuric acid which takes the key role to extract Uranium from its ores.
Besides U3O8 Uranium ores contain the oxides / salts of Silicon, Iron, Molybdenum , Nickel, Aluminium, Calcium, Magnesium, Copper, Cobalt, Manganese, Sodium , Potassium, Fluorine, Vanadium, Titanium, Carbon, Sulphur, Phosphorus, rare earths and gangues.
Numerous operations are performed to extract pure Uranium from those ores and those operations need energy intake. Uranium Exporter countries have expended that energy at source to extract Uranium from national mining reserves in order to supply that Uranium to France.
French nuclear reactors in 2004 produced only 342 TWh of electricity from 10,500 tons of Uranium, but the energy required to produce that Uranium fuel from available Uranium ore should be assessed independently.
Therefore, we demonstrate below the energy expenditure of a real famous Uranium manufacturing unit, Olympic Dam having ores with 0.067 % Uranium content. As of 2013, Olympic Dam was the second largest uranium-producing mine in the world, having produced 41, 00 to 4,200 tonnes (out of 59,331 tonnes world production) in the financial year ending June 2013 . The only larger producer was the MacArthur River uranium mine in Canada in that financial year.
Illustrative Example: Olympic Dam
The process of Uranium separation from the low Uranium content ore is tedious, troublesome and energy consuming. Uranium is highly toxic and it attacks kidney. It is claimed that it causes birth defects and increases the risk of leukemia. People working in the Uranium mines are exposed to the direct radiation of Uranium. Miners are to inhale Uranium ore dust which accumulates in the lungs and causes lung cancer. Moreover, Uranium emanates Radon. Miners are to breath in air contaminated with Radon which causes lung cancer.
We are tabulating below the energy required to separate 1 gram of Uranium from its now available ores.
Uranium extraction from low Uranium containing ores is done through the following processes now a day [IAA (1993),19-24].
Mining: Mining first starts with Open Pit mining and as the ore depth increases , underground mining become advantageous. Rock fragmentation is generally done through the use of explosives. For loading hydraulic or electrical shovels are used. Then Ores are classified and sorted as per radiometric gradation and transferred for milling. Mining waste are treated and disposed. Dosimetric survey of the mining workers is conducted. Total energy expenditure to operate machineries and to prepare the explosives is not known.
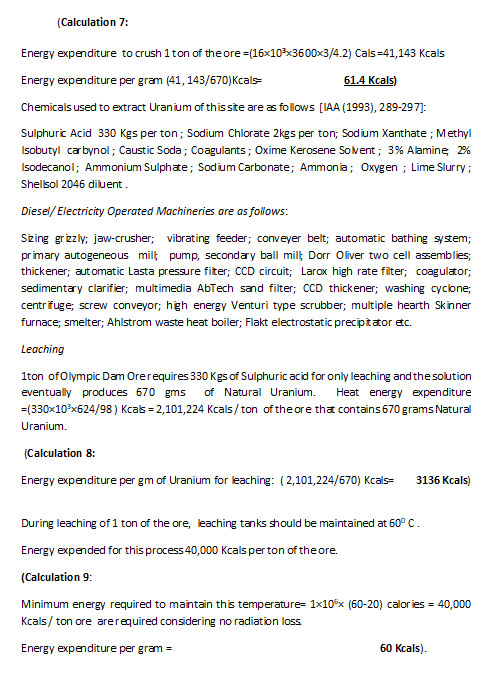
Crushing, Grinding and Roasting: Sorted ores are crushed and ground for leaching either with acids or alkalis. Total energy expenditure to operate the machineries is not known. A secondary ball mill works here with a work index of 16KWh/ton [IAA (1993),292].
Leaching: Crushed and ground ore are treated with acids in five mechanically agitated tanks maintained with 550-600 centigrade by injection of steam.
Solid Liquid Separation: Energy required is not known
Solvent Extraction Process: Different chemicals are used in this process to separate Uranium. Energy expenditure to prepare those chemicals are not known.
Precipitation with Magnesium Oxide, Ammonia and Hydrogen Peroxide: Energy expenditure to prepare those chemicals are not known. So are the cases for Drying/ Calcining and Product Recovery. Energy expended for waste management is high. But any reliable data is not available.
Water required in Olympic Dam
In the Olympic Dam after leaching and solid –liquid separation, Uranium is extracted in three stages using an amine-kerosene solvent in Krebs mixer settlers. The extraction circuit is operated in the organic continuous mode, with solvent recycling to give an O/ A ratio of 1.5-1.7:1 in mixer. In solvent extraction, alamine 336 is used in a kerosene diluents, and the phases move counter currently. The loaded solvents may then be treated to remove impurities. First, cations are removed at pH 1.5 using sulfuric acid and then anions are dealt with using gaseous ammonia. The solvents are then stripped in a countercurrent process using ammonium sulfate solution. Precipitation of (NH4)2U2O7 (ammonium diuranate) is achieved by adding gaseous ammonia to neutralize the solution. The diuranate is then dewatered and roasted to yield U3O8 product, which is the form in which uranium is marketed and exported.
Energy expenditure per gram of Uranium extracted in most of the operations excepting the following three viz., crushing, leaching and water treatment is unknown. Energy expenditure of these three known processes is given below.
Crushing
A secondary mill with work index of 16 KWh /ton is used for crushing. Equivalent heat energy 41, 143 Kcals / per ton of the ore that contains 670 grams natural Uranium.
Water treatment
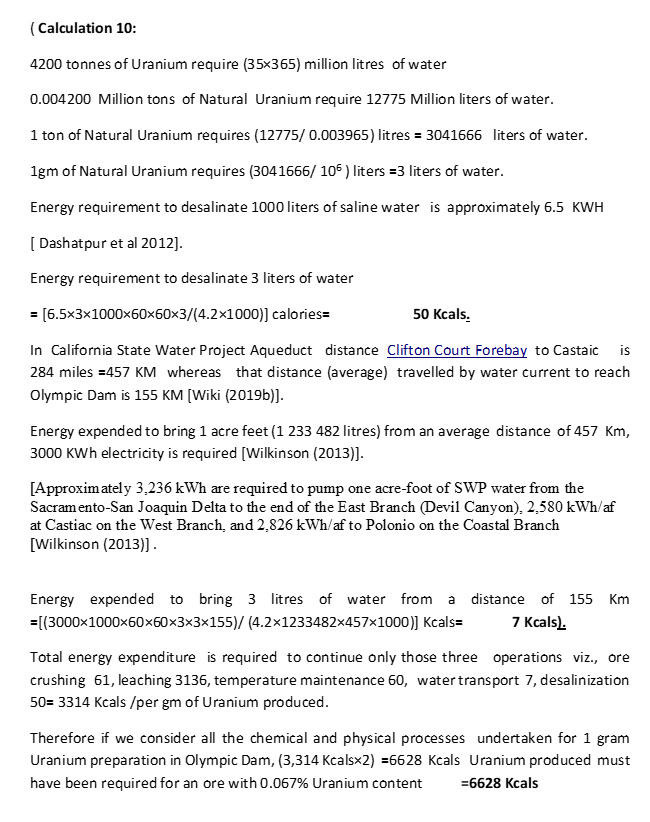
The Olympic Dam uses 35 million liters Great Artesian Basin water each day making it the largest industrial user of underground water in the southern hemisphere. This water is pumped along the underground pipe line from two bore fields which are located 110 Kms and 200 Kms north of the mine . The salty water is desalinated before it is used. Contaminated water from the mine is passed through a series of sealed ponds where it evaporates. Pumping out of this huge amount of water from the Great Artesan Basin is drying the nearby mound springs for which the aridity of the region is increasing and in consequence many rare and endemic species in the region are in danger. The mine produces 4200 tons of Uranium per year . [ In 2013 it produced 4200 tons of Uranium][Wiki (2019 b)].
Results:
We may prepare a chart of energy investment for preparation of 1 gram of natural Uranium from Uranium ores with varied Uranium content and surplus energy available from I gram of Uranium burn-up depending on the grade of ores.
Table II. Surplus Energy per gram of Uranium Burn-Up
[Burn –up energy per gram of Uranium 80,000 Kcals; Energy Expenditure for reactor commissioning &decommissioning etc. per gram of Uranium 38,223 Kcals].
Percentage of Uranium per gram in the ore
(1) |
Energy expenditure for preparation of Uranium Kilocalorie per gram
(2) |
Surplus Energy Kilocalorie per gram of Uranium
(3)
= 80,000−[38,223+(2)] |
(i) 0.067 |
6,628 |
+35,149 |
(ii) 0.05 |
8,882 |
+32,895 |
(iii) 0.01 |
44,408 |
−2631 |
(iv) 0.1 |
4440 |
+37,337 |
(v) 0.2 |
2220 |
+39,557 |
(vi) 0.4 |
1,110 |
+40,667 |
Figures given in column (3) of (i) and (iii) suggest the proposition (C) : fuel viability of Uranium prepared from the ores containing 0.067% or more Uranium may be positive, but that prepared from 0.01% Uranium Ore is negative.
Therefore, we may conclude that as per French data Uranium obtained from ores with 0.067% Uranium may be a real fuel. But Uranium produced from ores with 0.01% Uranium could hardly be considered as a real fuel. Rather that Uranium is false fuel.
Is nuclear power really low-carbon?
There was a time when promoters and defenders of atomic energy would utilize slogans such as, “ Let us go play in the nuclear power park” [ Gofman and Tampler 1973]. But nowadays it is well known that from mining to nuclear waste management, Uranium and other nuclear materials have always caused radiation hazards. Similarly, the modern or most recent slogan utilized by atomic people is that nuclear electricity is "clean", but this has declining credibility [ Burke et al.(2011)].
We show below that to extract 10,500 tonnes of Uranium from Uranium ores with 0.067% Uranium Content, energy required in ultimate analysis is equal to 710220 X 108 Kcals .
The exporter countries have used fossil fuels equivalent to the combustion of 8.9 million tonnes of carbon that have emitted 32.6 million tonnes of Carbon-di-Oxide in their own countries to produce that Uranium and this saved France from further Carbon-di-Oxide pollution.
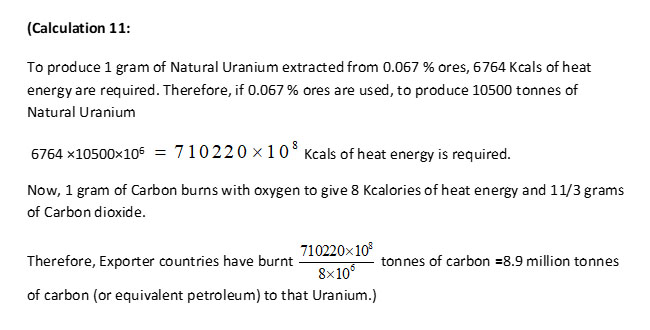
Therefore, Exporter Countries have produced ( 8.9×11/3) million tonnes =32.6 million tonnes of Carbon dioxides and polluted their own countries with that carbon dioxide which has saved France from further pollution.
To defend nuclear electricity IAAE (2016) argues that GHG emissions from nuclear power plants (NPPs) are negligible. But the essence of this argument does not seem to be motivation-free.
Therefore, in terms of fossil fuel expenditure the data analysis suggests the proposition (D): Exporter Countries (if uses 0.067% Uranium ores) have produced 32.6 million tonnes of Carbon dioxides and polluted their own countries with that carbon dioxide which has saved France from further pollution. If 0.01% ores are used, 218.4 million tonnes of carbon-di-oxide would be emitted.
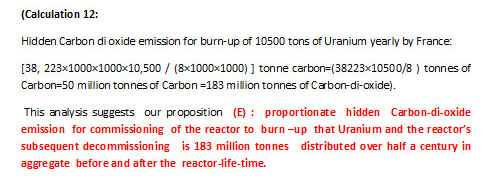
Now France has already expended ( many years before the operating of the reactor) and yet to be expended ( for a period of many years after shutting down of the reactor) 38, 223 Kcals of energy per gram of Uranium. In that case a further 183 millions tons of Carbon-di-oxide has been emitted and yet to be emitted covering a long period to burn –up yearly 10500 tonnes of Uranium by France which has not contributed to the present yearly carbon-di-oxide emission scenario from nuclear energy heading and therefore has remained hidden.
French nuclear power--not cheap
D. B. Lilienthal, the first Chairman of the Atomic Energy Commission of USA, commented that the tapping of energy from nuclear source seems to be a mirage: “The new world of atomic plenty does not exist.” He openly criticized the USA Government for the huge expenditure of public funds on nuclear electricity, which was more costly than electricity obtained from coal [ Lilienthal (1963)].
Miller mentioned that nuclear taxes have been levied indirectly in USA but do not show up on electric bills, and commented that from an economic standpoint alone, relying on nuclear fuel as the primary source of national stationary (electric) energy would be economic lunacy [Miller (1976)]. Some notably accused that nuclear energy and power accounting of USA being misleading. They argued that nuclear electricity is supplied at low cost because of large federal grants and subsidies, and most economic estimates of the cost of nuclear power were biased because they do not include the cost of subsidies and other aid programs [ Desaix (1977)].
Indian studies corroborate the views of the western critics. S. Bhattacharya & S. Mukherji were moved to declare that nuclear power is actually a bluff [Bhattacharya & Mukherji (1993)] whereas Ramana et al in 2005 were confident enough to say that “This contradicts numerous claims by the DAE (Indian atomic energy agency) that nuclear power is cheaper than coal-fired thermal power at sites which are 800-1,000 km away from coal mines. Nuclear power plants, therefore, have been and remain a costlier way of trying to address India’s electricity needs, than coal based thermal plants” [Ramana et al. (2005)].
In a MIT study of 2003 the participants confess that in deregulated markets, nuclear power is not now cost competitive with coal and natural gas [ MIT (2003)]. Andrew MacKillop [ McKillop (2011); McKillop (2012a-e)] in a series of articles has commented that nuclear power is not cheap.
Capital Cost
A study shows that the capital costs for generating renewable energies will steadily decrease whereas the same for nuclear energy will remain static for the coming decades [Schröder et al ( 2013)]. A MIT study [MIT (2018), pp. xix- xx] recently echoes, “The cost of new nuclear plants is high”, “ New nuclear plants are not a profitable investment in the United States and Western Europe today. The capital cost of building these plants is too high”.
End of life and dismantling cost
The Cour des Comptes report has shown that ‘end of life and dismantling costs’ are, not surprisingly the most challenging factor, and its report takes many precautions in its calculating methods and bases. Its data tables suggest that an average likely cost in euros of 2010 value, of 3.8 billion euros 2010 for each of the 63 main civil reactors of France, will probably be the spending provisions required, starting in the immediate and up to 2025
[CCMR (2012), 269].
Through 2012-2025, if not provided 10-year operating life extensions, at least 11 French reactors will need decommissioning, for a total cost through a time period of up to, or more than 30 years ahead, of around 32 billion euro in euro 2010 [ CCMR (2012), 86]. Other data in the report suggests that prolonging the operating lifetime of these reactors, and other reactors in the French 'fleet' will require the spending of 55 billion euros2010 in the period 2012-2025, for additional safety and maintenance provisions[CCSR (2012), 17].
Government and public sector fund
The Cour des Comptes provided details on as many previous and historical known costs of French nuclear power that it was able to identify. It estimated that French nuclear power, through 1957-2011 received a total of around 228 billion euros2010 from the Public sector and the operators [CCMR (2012), 270 ). It received 38 billion euro2010 in the form of government-funded nuclear R & D [ CCMR (2012), 285] and an initial investment of 96 billion euro2010
[CCMR (2012), 266] in the 58 current reactors that presumably has come from the State.
The Real Economic Costs of Nuclear Electricity
The Cour des Comptes report for French nuclear reactors estimated that the Current Economic Cost with extension of life expectancy investment (Generation 2, PWR) is 54 Euro2010/MWh [Percebois 2012] and Current Economic Cost without extension of life expectancy investment (Generation 2, PWR) is 49.5 euro2010/ MWh [ Percebois 2012]; but this was billed by EDF the former state monopoly electricity provider, and present owner of all French nuclear plants at 33.4 euro2010 per MWh [CCSR (2012), 14]. CCSR (2012) went on to state the obvious: power prices must rise soon, and by 15% to start with, in the absence of government subsidy decisions. Several scenarios are shown in the report, mostly in the range of a 33%-50% rise in French bulk electricity prices by as soon as 2017. The Cour des Comptes notes that future nuclear power was unlikely to be cheaper than 80 euro2010 /MWh [ Paris( 2012)].
Maintenance costs for the French nuclear plants are estimated by the Cour des Comptes as more than doubling, from 1.5 billion euro2010-per-year, to 3.7 billion2010 in the next decade, to 2022 [CCMR (2012), 269] with much of the rise "front loaded" to the period 2012-2017. This alone will push power prices up another 10%-15% from current prices, the report estimated [CCSR (2012), 11].
Fuel reprocessing and waste disposal costs, the Cour des Comptes estimates will grow at about 6% per year, at least doubling in the next 12 years. Overall, long term waste stockpiling and safekeeping through the next 10-15 years was estimated as likely to cost 22 billion euros2010 [CCMR (2012), 226], not far behind the early and initial costs of reactor dismantling and Safestor. Recently, IAAE (2018) remarks that Nuclear power is not competitive.
Alternatives to nuclear power - for France
The Cour des Comptes has avoided to suggest on alternative and available non-nuclear generating options ranging from wind power and solar PV, to gas, coal, hydropower, wave power, geothermal and biomass energy [CCMR (2012g)]. In the UK scenario, it seems that electricity generated from off shore wind is cheaper than nuclear electricity [ Paris, (2012)]. In India electricity produced from coal must be much cheaper than electricity produced from metallic Uranium. The Cour des Comptes study shows that France has not much benefited herself in energy sector from her nuclear fuel/ nuclear electricity as she professes.
Schneider et al (2017), experts in the nuclear industry of France find that New renewables beat existing nuclear. Renewable energy auctions achieved record low prices at and below US$30/ MWh in Chile, Mexico, Morocco, United Arab Emirates, and the United States. Average generating costs of amortized nuclear power plants in the U.S. were US$35.5 in 2015.
This analysis suggests the proposition (F): France’s nuclear power is in no way more competitive or of lower cost than many of other options for supplying electric power.
Prospects of Nuclear Energy in India
France generally uses Uranium ores with 0.3% Uranium content and according to the official nuclear specialists one gram of Natural Uranium possesses a burn-up energy of 1,74, 000 Kilocalories (?). Still France’s real cost of 1 unit of electricity is little less than the real cost of 1 unit of energy generated from coal which gives only 8 kilocalories of heat per gram. Therefore, from reactor building to disposal, a huge amount of energy and special materials that consumes energy too have been used for these operations and this has made the metal fuel practically of no better utility than coal .
In the present decade available Uranium ores for India will not contain Uranium more than 0.01%. Taking into account reactor installation, reactor management, decommissioning of the reactors, radioactive disposal and after- Fukushima-Surveillance work, Energy expenditure per gram of Uranium produced from this ore should be (38,223 +44,408=) 82,631 Kcals , whereas the burn-up energy of 1gram of Uranium has been shown to be approximately 80, 000 Kcals.
Most of the ore available in India, Pakistan and Korea rarely contains more than 0.01 % Uranium. Therefore, in any case, these countries in the prevailing scenario should never expect to gain energy-profit from using Uranium fuel for their energy needs if they use their own Uranium ores or they buy ores of the same grade from Africa.
However, India has taken some initiative to collect Uranium from Niger. Most of the ores from Niger contain 0.047%-0.11% Uranium and India will hardly be able to snatch Niger mines with high grade Uranium from the tight fists of France and China.
Due to dwindling domestic uranium reserves,[electricity generation from nuclear power in India declined from 2006 to 2008.
In March 2011 deposits of uranium were discovered in the Tummalapalle belt and in the Bhima basin at Gogi in Karnataka . Uranium contents of the ores of Bhima basin have been described as 10-110 ppm to 308 ppb [Kothari et al (2019)] but those of the Tummalapalle belt have not been stated.
In recent years, India shows increased interest in thorium fuels and fuel cycles because of large deposits of thorium in the form of monazite in beach sands. Energy expenditure to extract Thorium from beach sands will likely not be energy competitive with Uranium ores.
During 2015-2019 Kazakhstan has provided 5,000 tonnes of metallic Uranium [Wiki (2019c)]. In that case the burden of extraction of Uranium lied on Kazakhstan. India is to pay them as per bilateral treaty which does not reflect the energy expenditure which is likely to be very high.
Our Question:
Therefore, we may naturally ask the nuclear technologists of India: if France has no better or little better utility of Uranium fuel processed from 0.3 % ores than coal , how India will get benefit using her 0.01 % domestic grades of Uranium ores or 0.1% grades of Uranium ores imported from Niger?
Acknowledgment: We thank Andrew McKillop (Former Expert-Policy & Programming, DG XVII Energy, European Commission) who edited the economic part of the paper with alteration and much addition.
References:
Bhattacharya, S. , Mukherji, S. (1993) “ The Bluff of the Epoch-Nuclear Power I & II”, Frontier Vol. 26 , No.14, pp 8-12; Vol. 26, No. 15, pp 5-9.
Burke, Tom et al. (2011) : Climate Change and Energy Security (Energy Environment and Development Programme (Chatham House). http://www.jonathonporritt.com/sites/default/files/users/BRIEFING%205%20-%20Climate_and%20energy%20security_27_April%202012.pdf .*
CCSR (2012): The Costs of Nuclear Power Sector, Summary of the Public Thematic Report by the Cour des Comptes. The costs of the nuclear power sector.
https://www.ccomptes.fr/sites/default/files/EzPublish/Costs_nuclear_power_sector_summary.pdf .*
CCMR (2012): The Costs of Nuclear Power Sector, Thematic Public Report, Cour des Comptes, Main Report. The costs of the nuclear power sector.
https://www.ccomptes.fr/sites/default/files/EzPublish/thematic_public_report_costs_nuclear_%20power_sector_012012.pdf. *
Dashtpour, Reza, Al-Zubaidy ,Sarim N. (2012): Energy Efficient Reverse Osmosis Desalination Process. International Journal of Environmental Science and Development 3 (4).
(In a typical seawater reverse osmosis plant, 3 to 10 kWh of electric energy is required to produce one cubic meter of freshwater).
http://www.ijesd.org/papers/243-B20001.pdf .*
Desaix, Myer III (1977). The Nuclear Power Debate ( New York:Praeger Publishers) , p.19.
FEMFS (2004) : France-Energy Mix Fact Sheet 2004.
http://ieepa.org/news/Other/20100917174353200.pdf. *
Feiveson, H. A. (2004): Nuclear Proliferation and Diversion, In Cleveland, Cutler J. (ed)
Encyclopedia of Energy,Vol. 4 (Elsevier), p. 435.
Gofman. J.W. and A. R. Tampler (1973) : Poisoned Arrow (Chatto and Windus, London), pp. 182-183.
Herring, J. Stephen (2004) : Uranium and Thorium Resource Assessment. In Cleveland Cutler J. (Ed), Encyclopedia of Energy, Vol. 6 (Elsevier), p. 281.
Himmeblau, David M. (1996) : Supplementary problems for basic principles and calculations in chemical engineering (Copyright David M. Himmeblau).
Hyett, A. J. (1984): The Structure and Economics of the Nuclear Fuel Cycle Service, In Brookes, L. G. and H Motamen (Ed.), The Economics of Nuclear Energy (Chapman and Hall), pp. 163-169.
Index Mundi (2019 a): France Oil consumption by year
[2004 : 2008 000 barrels per day×365=732920, 000 barrels =733 million boe= 102.62 million toe. (1 Mboe = 0.14 Mtoe)].
https://www.indexmundi.com/energy/?country=fr&product=oil&graph=consumption .*
Index Mundi (2019 b): France Coal Consumption.
[(1 short ton = 0.907185 metric ton)
2004: 23767 000 short tons= 21,561,065 metric tons =21.56 million metric tons]
https://www.indexmundi.com/energy/?country=fr&product=coal&graph=consumption.*
IAA (1993): Uranium Extraction Technology, (IAEA publication), International Atomic Agency.
http://www-pub.iaea.org/MTCD/publications/PDF/trs359_web.pdf .*
IAEA (2016). Climate change and nuclear reactor 2016. International Atomic Energy Agency (2016).
https://www-pub.iaea.org/mtcd/publications/pdf/ccanp16web-86692468.pdf .*
IAAE (2018) : 36th USAEE/IAEE North America Conference Washington DC, 24th September 2018 . 36th USAEE/IAEE. Cost Estimates and Economics of Nuclear Power Plant Newbuild: Literature Survey and Some Modelling Analysis.
http://www.usaee.org/usaee2018/submissions/Presentations/2018-09-24_nuclear_economics_Wealer_Ben_USAEE.pdf .*
Kothari,M., Rai., A. , Parihar, P. (2019) : Ore genesis of Gogi uranium deposit in Bhima Basin, Yadgir District, Karnataka, India.
https://inis.iaea.org/collection/NCLCollectionStore/_Public/48/039/48039521.pdf .*
Lilienthal, D.E. (1963) : Change, Hope and the Bomb (Princeton University Press), pp. 116-117, 105.
MIT (2003): The Future of Nuclear Power: An Interdisciplinary MIT Study, Massachusetts Institute of Technology.
http://web.mit.edu/nuclearpower/pdf/nuclearpower-summary.pdf .*
MIT (2018) : The future of nuclear energy in carbon-constrained world . Massachusetts Institute of Technology.
https://energy.mit.edu/wp-content/uploads/2018/09/The-Future-of-Nuclear-Energy-in-a-Carbon-Constrained-World.pdf.*
McKillop, Andrew (2011) : Uranium Outlook . Energy & Environment, 24 (4) 441-445.
McKillop, Andrew (2012a) : Financial and Economic Factors Negative to Nuclear Power –Summary , an article sent to the author.
McKillop , Andrew (2012b) : Europe’s Nuclear Exit Strategy, an article sent to the author.
McKillop , Andrew (2012c) : Germany Exits Nuclear Power –Major Challenges following an Historic Decision. Energy & Environment 23 (4) 657-660.
McKillop, Andrew (2012d) : French Nuclear Power –not cheap, an article sent to the author.
McKillop, Andrew (2012e): Germany’s Energy Transformation Megashift or Megaflop? An article sent to the author.
Miller, S. (1976) : The Economics of Nuclear and Coal Power (Praeger Publishers. New York), p. 101.
Paris, Jerome A (2012) : Is nuclear energy more expensive than offshore wind? This is what is suggested in an article of the Times of London, Daily Kos, Wed Jul 18.
http://www.dailykos.com/story/2012/07/18/1111331/-Is-nuclear-energy-more-expensive-than-offshore-wind .*
Percebois, Jacques (2012): 12th IAEE European Energy Conference, Electricity Pricing : French Paradox .
Ramanna, Raja (1975): Future of Nuclear Technology (Bangalore University), pp 8-9.
Ramana, M. V., Antonette, D’Sa, Reddy, Amulya, K. N. (2005). Economics of Nuclear Power from Heavy Water Reactors,Economic and Political Weekly, April 23.
Sg, G.T. (1959) Uranium, Encyclopedia Britannica, Vol. 22 (Encyclopedia Britannica, Ltd. Chicago), p. 888.
Schneider, Mycle and Froggtt, Antony (2017). The world of nuclear industry status report 2017, A Mycle Schneider Consulting Project Paris, September 2017, p.12.
https://www.worldnuclearreport.org/IMG/pdf/20170912wnisr2017-en-lr.pdf .*
Schröder, Andreas; Kunz, Friedrich; Meiss, Jan; Mendelevitch, Roman; von
Hirschhausen (2013). Christian Research Report : Current and prospective costs of electricity generation until 2050, p. v. Econstor.
Wiki (2019 a). Plutonium. Wikipedia, the free encyclopedia.
https://en.wikipedia.org/wiki/Plutonium .*
Wiki (2019). Olympic Dam Mine. Wikipedia, the free encyclopedia.
https://en.wikipedia.org/wiki/Olympic_Dam_mine .*
Wiki (2019 c) . Nuclear Power in India. Wikipedia, the free encyclopedia.
https://en.wikipedia.org/wiki/Nuclear_power_in_India .*
Wilkinson, Robert C (2006). An analysis of the energy intensity of water in California.
https://aceee.org/files/proceedings/2006/data/papers/SS06_Panel12_Paper14.pdf.*
WNA (2019). Nuclear Power in France. World Nuclear Association.
http://www.world-nuclear.org/information-library/country-profiles/countries-a-f/france.aspx .*
WSA (2014). Fact Sheet Energy, World Steel Association. https://www.worldsteel.org/en/dam/jcr:f07b864c-908e-4229-9f92-669f1c3abf4c/fact_energy_2019.pdf .*
WSA (2019): Raw Materials , World Steel Association.
https://www.worldsteel.org/steel-by-topic/raw-materials.html .*
(viewed on 22-06-2019)
Frontier
May 26, 2020
Sankar Hajra sankarhajra@yahoo.com
Your Comment if any
|